
Test one page before you pay for a year
Choosing hosting or a site builder on a small budget is stressful: every plan promises speed, the cheapest prices need years paid up front, and you only find out after paying. A free Lighthouse test of one real page, built on the free plan or trial, tells you more than a feature list. The catch is that the score moves between runs, so a single number can mislead you either way. Here is how we use Lighthouse on this site, with our own reports: the runs, the spread we saw on one page, what we changed, and what a lab test cannot tell you.
The five numbers in plain words
- Performance score: a 0-100 summary of the timings below; 90 or more shows as green.
- Largest Contentful Paint: how long until the biggest thing on screen (usually the headline or main image) appears.
- Total Blocking Time: how long the page is too busy running code to react to a tap.
- Layout shift: how much things jump around while loading; 0 means nothing moved.
- Speed Index: how quickly the visible part of the page fills in overall.
When you compare two hosts or builders on their free plans, build the same simple page on each, run this test three times on both and compare the medians. Our own numbers below show what a normal spread looks like.
Our homepage, three runs each on mobile and desktop
We ran Lighthouse 12.8.2 against our homepage three times on its mobile setting and three times on its desktop setting on 2026-10-22. Every run is in the table below.
| Device | Run | Performance | Largest Contentful Paint | Total Blocking Time | Layout shift | Speed Index |
|---|---|---|---|---|---|---|
| mobile | run 1 | 97 | 1.9 s | 70 ms | 0 | 4.2 s |
| mobile | run 2 | 97 | 1.8 s | 180 ms | 0 | 2.8 s |
| mobile | run 3 | 97 | 1.8 s | 180 ms | 0 | 2.8 s |
| desktop | run 1 | 100 | 0.4 s | 0 ms | 0 | 0.7 s |
| desktop | run 2 | 100 | 0.4 s | 0 ms | 0 | 0.8 s |
| desktop | run 3 | 100 | 0.4 s | 0 ms | 0 | 0.7 s |
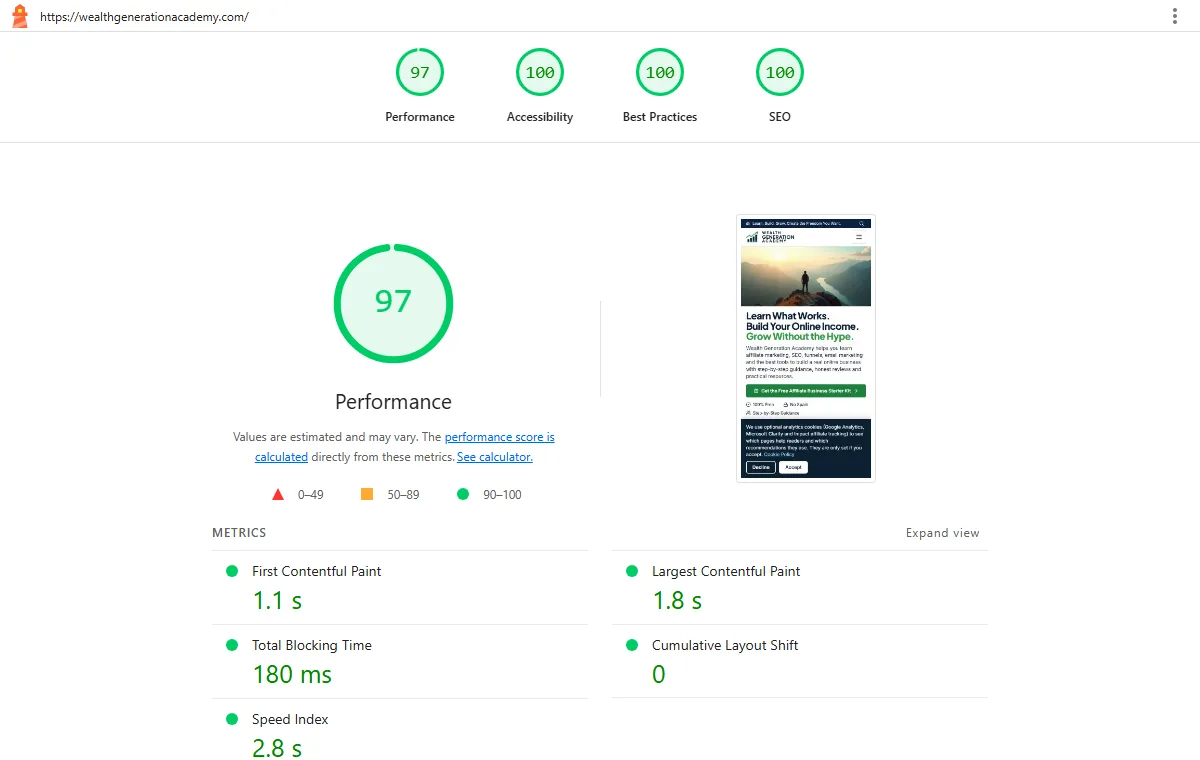
Every mobile run scored 97 for performance, yet the Speed Index ranged from 2.8 s to 4.2 s across the three identical runs. Desktop scored 100 each time.
One page, 11 runs: what moved the score
On /learn/email-follow-up, our longest lesson, mobile performance sat below our own bar of 95. We recorded every run while we fixed it:
| Stage | Performance runs | Median |
|---|---|---|
| before any change | 92, 92, 92 | 92 |
| after section layout containment | 96, 87, 96, 92, 94 | 94 |
| after removing a duplicate 200-word appendix | 86, 95, 98 | 95 |
Single runs ranged from 86 to 98 on the same page. The median rose from 92 to 94 after the first change and to 95 after the second. With runs this noisy, neither step on its own is proven to be the cause; what the medians do show is that the page now meets our bar, and that one run would have told us almost anything.
The workflow we use (you can repeat it)
- Test the page that matters, not only the homepage: a guide or a sign-up page is often heavier.
- Run it three times on the mobile setting (in Chrome DevTools or at PageSpeed Insights) and write down the median, not the best run.
- Read the metrics, not just the score: which element is the Largest Contentful Paint, and what is blocking the main thread.
- Change one thing, then run three times again and compare medians.
- Close other heavy programs while testing: runs taken while the computer was busy came out lower for us.
Using it to choose a host or builder
If you are deciding between two hosts (say Bluehost and Hostinger, which we compare in Bluehost vs Hostinger) or two page builders (see ClickFunnels vs Systeme.io), do this inside the trial or refund window, before the year is paid:
- Build the same simple page on both: one headline, one image, one sign-up form.
- Run Lighthouse three times on the mobile setting for each and compare the medians, not the best runs.
- If the medians are within a few points of each other, speed is not the deciding factor: choose on price at renewal, the features you will actually use, and support.
- Read the renewal price on each vendor’s own pricing page before you pay. Intro prices on both hosts are lower than what you pay when the plan renews.
Here is what the two entry plans cost when we checked each vendor’s own pricing page on 22 October 2026 (US dollars, before tax). Prices change often, so check again on the day you buy:
| Entry plan | Intro price | Term the intro price needs | Paid up front | Renews at |
|---|---|---|---|---|
| Hostinger Premium | $2.49/mo | 48 months | $119.52 (shown by Hostinger) | $10.99/mo |
| Bluehost Starter | $3.99/mo | 36 months | $143.64 (our arithmetic: 3.99 × 36) | $9.99/mo |
Both intro prices need a multi-year term paid up front, which is exactly why a test inside the refund window matters: run the three-run test on each before you commit, and put the renewal price, not the intro price, into your budget.
What to skip at the start: paid speed add-ons and premium themes sold as “faster”. Run the test first: our own homepage scores 97 on mobile with no paid speed add-on at all. Also skip judging a host by the speed claims on its homepage: test a page you built yourself.
Limitations we hit
- Lab, not real visitors. Lighthouse simulates a device and network. Google’s Core Web Vitals are judged on real-user data at the 75th percentile (web.dev), and our site does not have enough real-user data for Google to report it yet.
- Noise. A single run can be 12 points away from another on the same page, so one run cannot prove a fix.
- A score is not a ranking. A 100 here says nothing about whether the page answers the reader’s question.
Questions people ask about Lighthouse
Is Lighthouse free?
Yes. It is built into Chrome’s developer tools and powers PageSpeed Insights; everything on this page came from the free tool.
Why does my score change every time?
Each run simulates loading on a throttled device, and small timing differences add up. On one of our pages the same test gave 86 and 98; that is why we compare medians of three runs.
What score should I aim for?
We hold our own pages to 95 or more on all four categories, measured as a median. Treat any target as a guide: a fast page that does not help the reader still fails.
Your next step: test both before you pay
This week, start the trial or refund window on both hosts you are considering, build the same one-page test on each and run Lighthouse three times on mobile. Write down the two medians and the two renewal prices. If the medians are close, the renewal price decides it.
Compare Bluehost and Hostinger
Want the whole launch as a checklist? This test is check 4, “Run a simple launch test”, in the free Affiliate Marketing Tools Checklist, and our website lesson walks through it step by step.
Test notes: Lighthouse 12.8.2, mobile and desktop presets, live site, runs on 2026-10-22 and 2026-10-21; every run is in the tables above. Lighthouse and PageSpeed Insights are free Google tools, and we earn nothing from them. The Hostinger links on this page are affiliate links: we may earn a commission at no extra cost to you.